


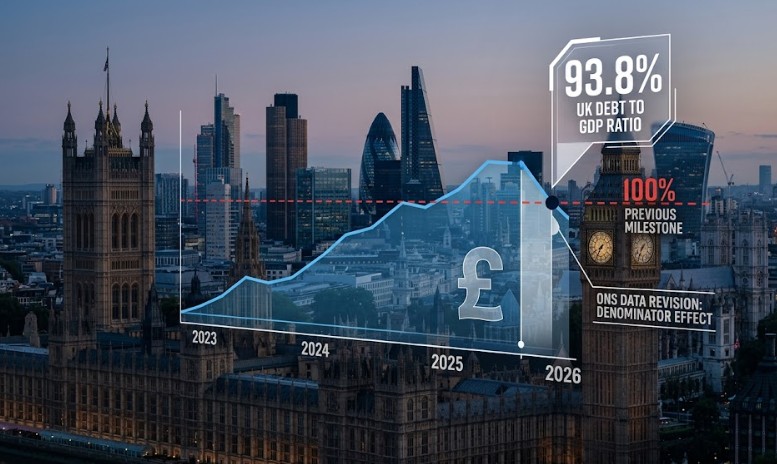
The UK’s fiscal narrative has undergone a dramatic transformation. For nearly two years, the psychological and political shadow of a 100% debt to GDP ratio loomed over Westminster, serving as a symbol of national economic fragility.
However, recent retrospective revisions by the Office for National Statistics (ONS) have effectively “erased” this milestone from the history books.
As of April 2026, the official standing of the UK debt-to-GDP ratio is being viewed through a lens of cautious stability. While the debt remains historically high, the narrative of a “breach” into triple digits has been replaced by a more complex story of a growing “denominator”, the UK economy itself, which has shown resilience even as UK economic growth rises despite global volatility.
Why has the 100% debt-to-GDP figure been revised?
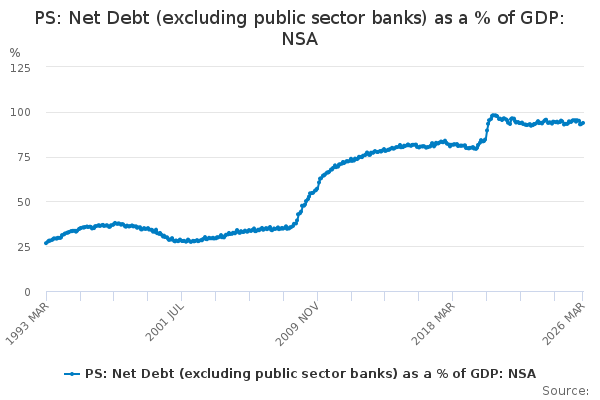
In May 2023, contemporary reports stated that UK public sector net debt had hit 100.1% of GDP, the highest level since March 1961. This figure was used by international bodies like the IMF to warn the UK about its fiscal trajectory.
However, the latest ONS data shows the ratio for that period was actually closer to 94%. This shift isn’t due to the government paying off debt, but rather the “denominator effect.”
The Denominator Effect Explained. The debt-to-GDP ratio is calculated as:
If the bottom number (GDP) is revised upwards because the economy grew faster than initial estimates, often due to higher-than-expected inflation or improved business data, the resulting percentage drops.
In this case, the UK economy in cash terms was significantly larger than the Office for Budget Responsibility (OBR) and the ONS initially projected.
What is the current UK debt-to-GDP ratio in 2026?
According to the ONS release on 23 April 2026, the UK’s public sector net debt (excluding public sector banks) was provisionally estimated at 93.8% of GDP at the end of March 2026.
Key Statistics for the Financial Year Ending (FYE) March 2026:
| Metric | 2025/26 Figure | Change from the Previous Year |
| Public Sector Net Borrowing | £132.0 Billion | Down £19.8 Billion (13.1%) |
| Debt to GDP Ratio | 93.8% | Up 0.6 percentage points |
| Net Financial Liabilities | 83.3% of GDP | Up 2.3 percentage points |
| Debt Interest Payable | £3.2 Billion (March) | Down £1.3 Billion |
Despite the downward revision of the “100% peak,” debt is still rising in absolute terms, now standing at approximately £2.91 trillion.
The fiscal landscape remains sensitive, especially as UK inflation hits 3.3% following geopolitical tensions, which impacts the interest the government must pay on index-linked gilts.
Where are these fiscal changes being felt most?
While the debt ratio is a national figure, its implications are concentrated in the UK’s financial and administrative hubs:
- The City of London: Gilt markets (where the UK borrows money) have reacted with relative calm. Investors like Barclays and Goldman Sachs analysts suggest that markets are more concerned with the future trajectory of debt than past statistical corrections.
- Newport (ONS Headquarters): The ONS continues to refine its “Blue Book” data, which provides the most accurate picture of the UK’s national accounts.
- Westminster: The HM Treasury is using these revised figures to calibrate the next Budget. The lower starting point gives the Chancellor slightly more “headroom” to meet fiscal rules, though high interest rates remain a significant constraint.
Who are the key authorities on this data?
To maintain accuracy, this report relies on verified UK entities:
- Office for National Statistics (ONS): The primary source for public sector finance bulletins.
- Office for Budget Responsibility (OBR): The independent watchdog that provides the forecasts the government must follow.
- The Bank of England: Whose interest rate decisions directly impact the “debt interest” the government must pay on its loans.
- Institute for Fiscal Studies (IFS): Providing independent analysis on how these debt levels impact long-term public spending.
How does the revised debt ratio affect the British public?
For the average resident in Birmingham, Manchester, or London, these numbers translate into real-world policy:
- Fiscal Headroom vs. Austerity: A lower debt-to-GDP ratio suggests the government may not be as “broke” as previously signaled. This could reduce the political pressure for immediate, drastic spending cuts to public services like the NHS or Transport for London.
- Mortgage Stability: When the UK debt ratio looks stable, international investors are less likely to demand high interest rates on UK gilts. This helps stabilize the base rates that dictate mortgage costs for homeowners.
- Taxation: With the ratio hovering below the 100% danger zone, the government has slightly more flexibility in its tax strategy, potentially avoiding emergency “wealth taxes” or further hikes to National Insurance.
What happens next for the UK economy?
The focus now shifts to the government’s “Rolling Target.” Under the Charter for Budget Responsibility approved in February 2026, the government aims to have Public Sector Net Financial Liabilities (PSNFL) falling as a share of GDP by the third year of the forecast.
- Audit Revisions: The ONS will release final audited figures for 2025/26 in late 2026.
- Interest Rate Impact: If the Bank of England begins cutting rates, the cost of servicing the £2.9 trillion debt will fall, further improving the ratio.
- Stagflation Risks: Analysts at PwC warn that if the conflict in the Middle East keeps energy prices high, the UK could face “stagflation,” where low growth makes the debt-to-GDP ratio harder to manage regardless of ONS revisions.