


Gold prices concluded last week on a firm note, holding above key moving averages and approaching major resistance levels.
With the market showing signs of bullish momentum, traders are watching closely for a breakout or reversal in the coming days. This week’s action will be driven by price behaviour around crucial pivot points, alongside upcoming economic data and geopolitical headlines.
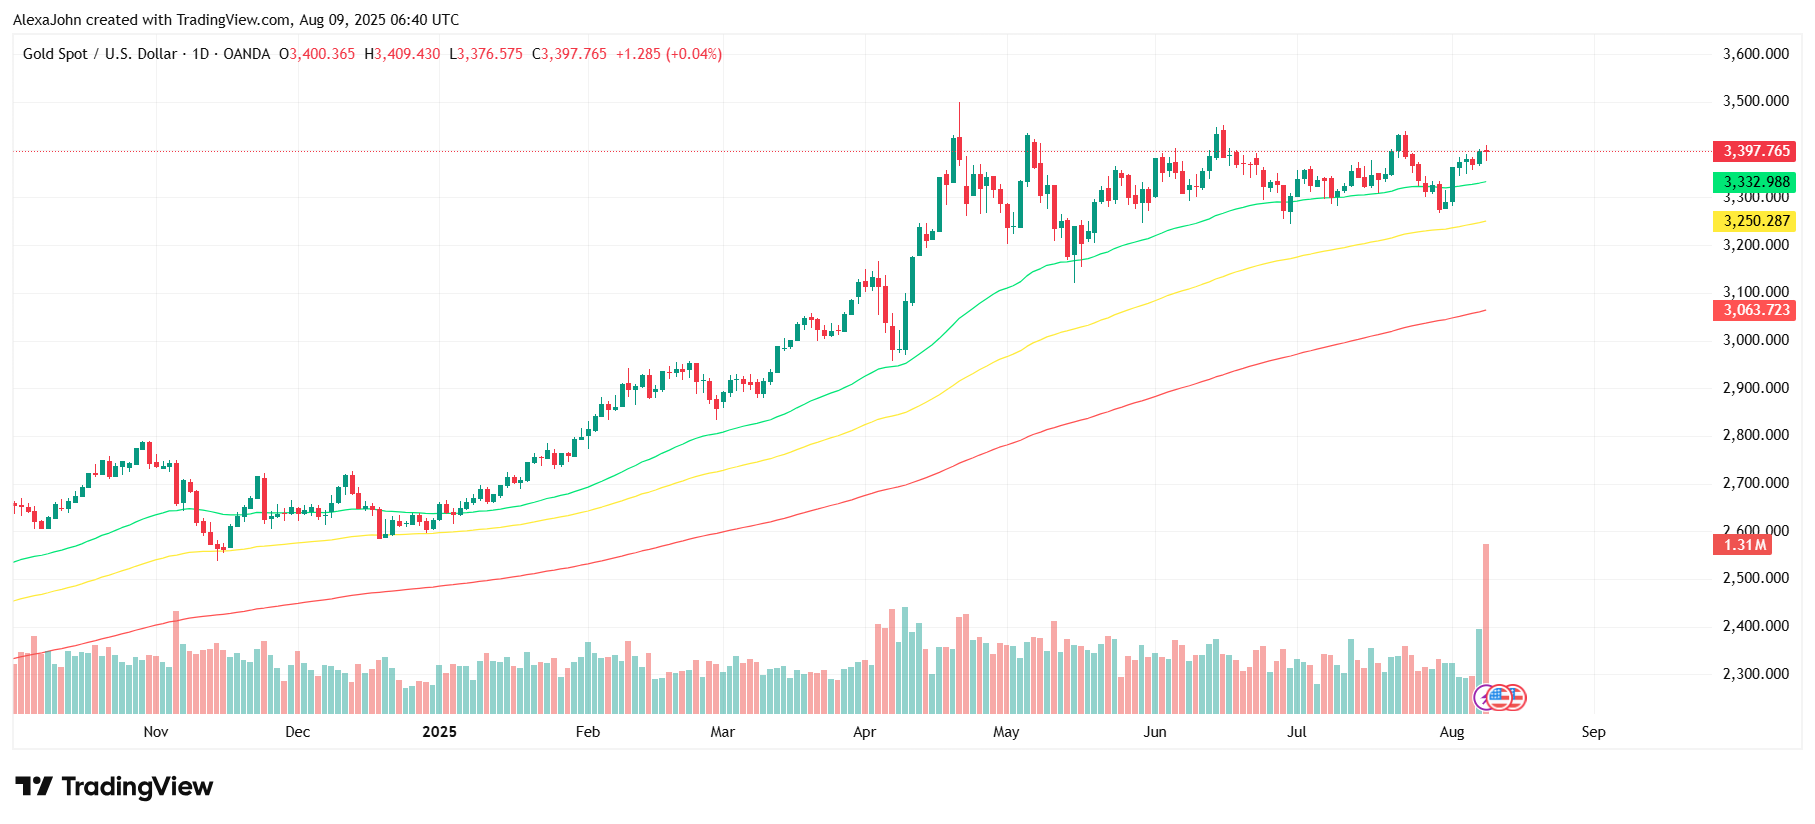
XAU/USD Last Week’s Performance
Gold (XAU/USD) saw steady gains but remained within a defined range. Gold traded steadily last week, moving within a controlled range as buyers maintained the upper hand. Prices stayed above the 50-day moving average, with momentum building toward a key resistance at $3,435.
- High: $3,403.42
- Low: $3,347.21
- Weekly Range: ~$56.21
- Closing Price: ~$3,399
The yellow metal held well above its 50-day moving average, maintaining a bullish bias. On the daily chart, an ascending triangle pattern is forming, with resistance clustered near $3,435 and strong support building above $3,245.
XAU/USD Weekly Pivot Points (11–15 August)
Pivot levels are key reference points for both intraday and swing traders. This week’s pivot points highlight $3,382 as a central reference, with resistance forming near $3,418 and support around $3,362. These levels will help traders identify potential breakouts or reversals during the week.
| Type | Pivot Point | Resistance 1 | Resistance 2 | Support 1 | Support 2 |
|---|---|---|---|---|---|
| Classic | $3,382.81 | $3,418.40 | $3,439.02 | $3,362.19 | $3,326.60 |
| Camarilla | $3,382.81 | $3,402.94 | $3,408.10 | $3,392.64 | $3,387.48 |
| DeMark | $3,387.96 | $3,428.71 | – | $3,372.50 | – |
XAU/USD Key Technical Zones
Gold’s technical map shows strong resistance at $3,435, a level that could unlock further gains if breached. On the downside, $3,362 remains the key support keeping the bullish structure intact.
- Strong Resistance: $3,435 – Breakout here could open the path to $3,500–$3,535.
- Strong Support: $3,362 – Below this, expect moves toward $3,327 and possibly $3,300.
- Moving Averages: Price is above the 50-day MA, while the 100-day and 200-day MAs remain much lower, signalling a sustained long-term uptrend.
XAU/USD Price Action Scenarios
Bullish Setup: A decisive push above $3,418–$3,420 could trigger a rally toward $3,435. If momentum holds, the next target sits at $3,500. Traders may consider entries above $3,420 with protective stops under $3,395.
Bearish Setup: Rejection at $3,420–$3,435 could send prices back toward $3,362. A confirmed break of this support would likely invite further selling toward $3,327.
Range-Bound Play: If the market stays between $3,390 and $3,418, range-trading — selling near resistance and buying near support- remains viable, provided stops are kept tight.
XAU/USD Multi-Time-Frame View
Short-term charts show gold consolidating near breakout levels, while the 4-hour pattern favours an upward move. The daily trend remains firmly bullish, supported by price action above the 50-day moving average.
- 15-Minute & 1-Hour: Tight sideways range; suited for scalpers targeting $5–$10 moves.
- 4-Hour: Ascending triangle formation; breakout bias slightly favours bulls.
- Daily: Overall bullish structure; dips remain supported above the 50-day MA.
Market Drivers to Watch
Upcoming US economic data and Federal Reserve commentary could set the tone for gold’s next move. Trade tariffs and global geopolitical tensions may further influence safe-haven demand through the week.
- US Inflation & Jobs Data – Could influence Federal Reserve rate expectations.
- Fed Officials’ Speeches – Any dovish remarks may strengthen gold’s appeal.
- Trade Tariff Headlines – Ongoing tariffs on gold and geopolitical uncertainty continue to support safe-haven demand.
- Global Risk Events – Any flare-up in tensions could accelerate buying.
XAU/USD Price Forecast
For the week of 11–15 August 2025, gold is poised to test the critical $3,420–$3,435 resistance zone. A confirmed breakout above this range could trigger a rally toward $3,500, with potential to stretch toward $3,535 if bullish momentum accelerates.
However, if price fails to clear resistance, a pullback toward $3,362 is likely, with deeper declines possible to $3,327.
Overall, the bias remains bullish while gold trades above its 50-day moving average, but traders should watch for clear price action signals before committing to positions.
Technical Summary Table
For the week ahead, $3,420–$3,435 stands out as the deciding zone. A break above it could ignite bullish momentum toward $3,500, while a failure here may lead to a retracement toward $3,362.
With technicals leaning positive and gold sitting comfortably above all major moving averages, traders may find more opportunity on the long side, but as always, confirmation from price action is essential.
| Scenario | Entry Zone | Target Levels | Stop-Loss Level |
|---|---|---|---|
| Bullish | Above $3,420 | $3,435 – $3,500 | Below $3,395 |
| Bearish | Rejection at $3,420–$3,435 | $3,362 – $3,327 | Above $3,440 |
| Range-bound | $3,390–$3,418 | Trade swings | Just outside range |
Disclaimer: This analysis is for informational purposes only and does not constitute financial advice. Trading involves risk; always conduct your own research before making investment decisions.